Live Data Streaming
Live Data Streaming publishes what the digital readout is doing to other software on your network. A shop running Ignition or another SCADA system can pull machine position in as tags for OEE and machine monitoring, a quality department can log probe touches, and a home shop can put the same numbers on a Home Assistant, Node-RED, or Grafana dashboard.
This is the job the RS-232 or Digimatic SPC data output port did on traditional consoles and bench gauges: getting readings out of the instrument and into logging or SPC software. TouchDRO publishes over the network instead, so there is no serial cable to run and no interface box to buy.
The stream is one-way and read-only. TouchDRO sends records out and ignores anything sent back, so nothing on the network can command the readout or change a setting. It is telemetry, suitable for dashboards, logging, and machine monitoring. It is not a control channel, not a safety interlock, and not a guaranteed-delivery record of every position: records can be dropped when a consumer reads slowly, when the broker is unreachable, or when the application leaves the foreground.
Turning It On
Live Data Streaming is part of TouchDRO Plus. On a machine profile without Plus, the switch is visible but can't be turned on, and its summary says that the feature requires Plus.
The feature is switched on in the "Live Data Streaming" section of the "Connection Settings" screen. Turning on "Enable Live Data Streaming" reveals "Configure Streaming", which opens the dialog where everything about the stream is set. Once the feature is on, the same dialog can also be opened from the "Live Data Streaming" entry in the main menu, or by pressing and holding the broadcast button in the toolbar. Both appear only while the feature is enabled, so on a profile where it is off there is nothing in the menu or the toolbar to find.
Transport
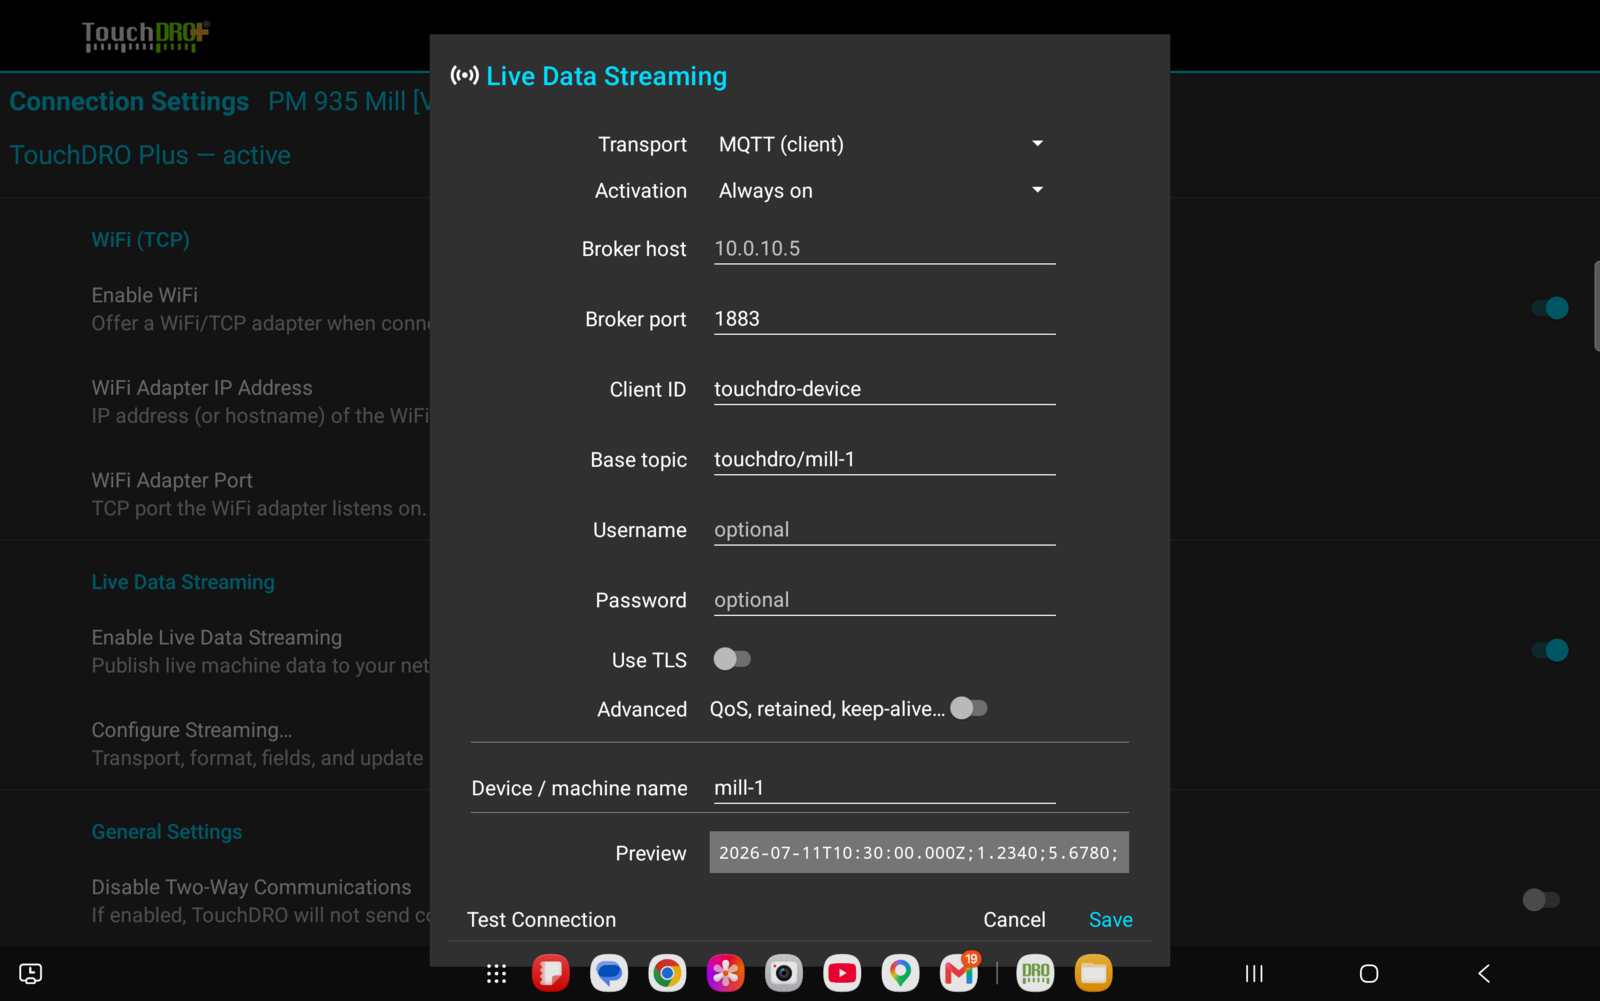
The "Transport" dropdown decides how the records leave the tablet. "TCP (server)" makes TouchDRO listen for consumers that connect to it; "MQTT (client)" makes TouchDRO connect out to a broker. Both carry the same records in the same formats, so the choice is about how your network is arranged rather than about what gets published.
"Activation" decides when the stream starts. "Always on" brings it up as soon as the application loads the machine profile, which is what a permanently monitored machine wants. "On demand (toolbar)" leaves it stopped until you start it with the streaming button.
"Device / machine name" names the machine this configuration belongs to, which matters once several machines are publishing into the same system.
TCP (Server)
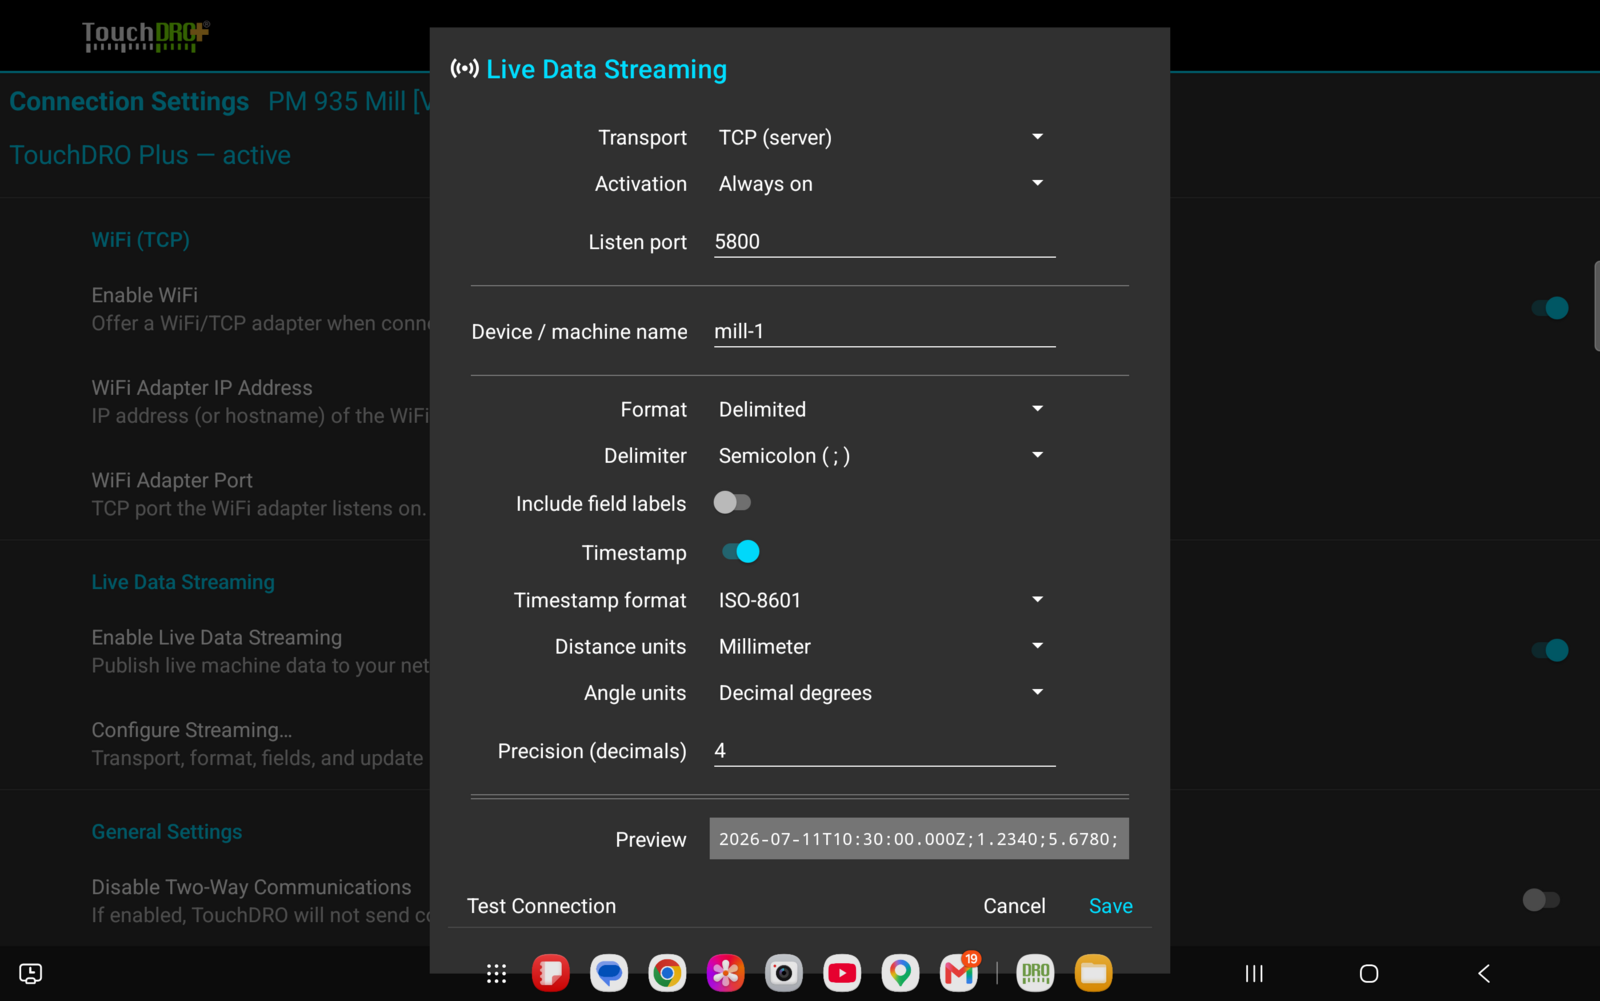
In this mode TouchDRO opens a listening socket on the tablet and streams records to whoever connects. "Listen port" sets the port, 5800 by default, and accepts anything from 1024 to 65535. Consumers connect to the tablet's own address on that port. Records are newline terminated, which is what the Ignition TCP driver and Node-RED expect.
Several consumers can be connected at once, and each of them gets every record. A consumer that stops reading is given the most recent record when it starts reading again rather than a backlog of stale positions, so one slow client can't hold up the others. Anything a client sends to TouchDRO is read and discarded.
MQTT (Client)
In this mode TouchDRO connects out to an MQTT broker, such as Mosquitto or the broker a Home Assistant installation already runs, which suits a network where the tablet moves around or sits behind a firewall. "Broker host" and "Broker port" point at the broker, 1883 for a plain connection and 8883 for TLS. "Client ID" identifies this tablet to the broker and has to be unique among the clients connected to it.
"Base topic" is the root of the two topics TouchDRO publishes on. Records go to the "data" topic under it, and a retained "online" or "offline" marker goes to the "status" topic, so a consumer can tell a quiet machine from a tablet that has gone away. A base topic of "touchdro/mill-1" publishes records on "touchdro/mill-1/data" and status on "touchdro/mill-1/status".
"Username" and "Password" are optional and are sent only if the broker asks for them. "Use TLS" encrypts the connection using the certificates your Android device already trusts. There is no option to accept an untrusted certificate, so a broker with a self-signed certificate needs that certificate installed on the tablet.
The "Advanced" toggle reveals the settings most installations leave alone: the QoS level, whether data messages are retained, the keep-alive interval, and the clean-session flag. Retained defaults to off on purpose. A retained coordinate looks current to a consumer that connects hours later, and simple consumers don't check the timestamp.
Format
"Format" chooses between "Delimited" and "JSON". Delimited records are one line of values separated by the character chosen in "Delimiter", with the choice of semicolon, comma, tab, or pipe. "Include field labels" writes each value as a name and value pair instead, in the form "x_absolute=1.2340". JSON records are one flat object per line, with the field labels as keys, bare numbers as values, and a sequence number that increases through the publishing session so a consumer can detect drops and reconnections.
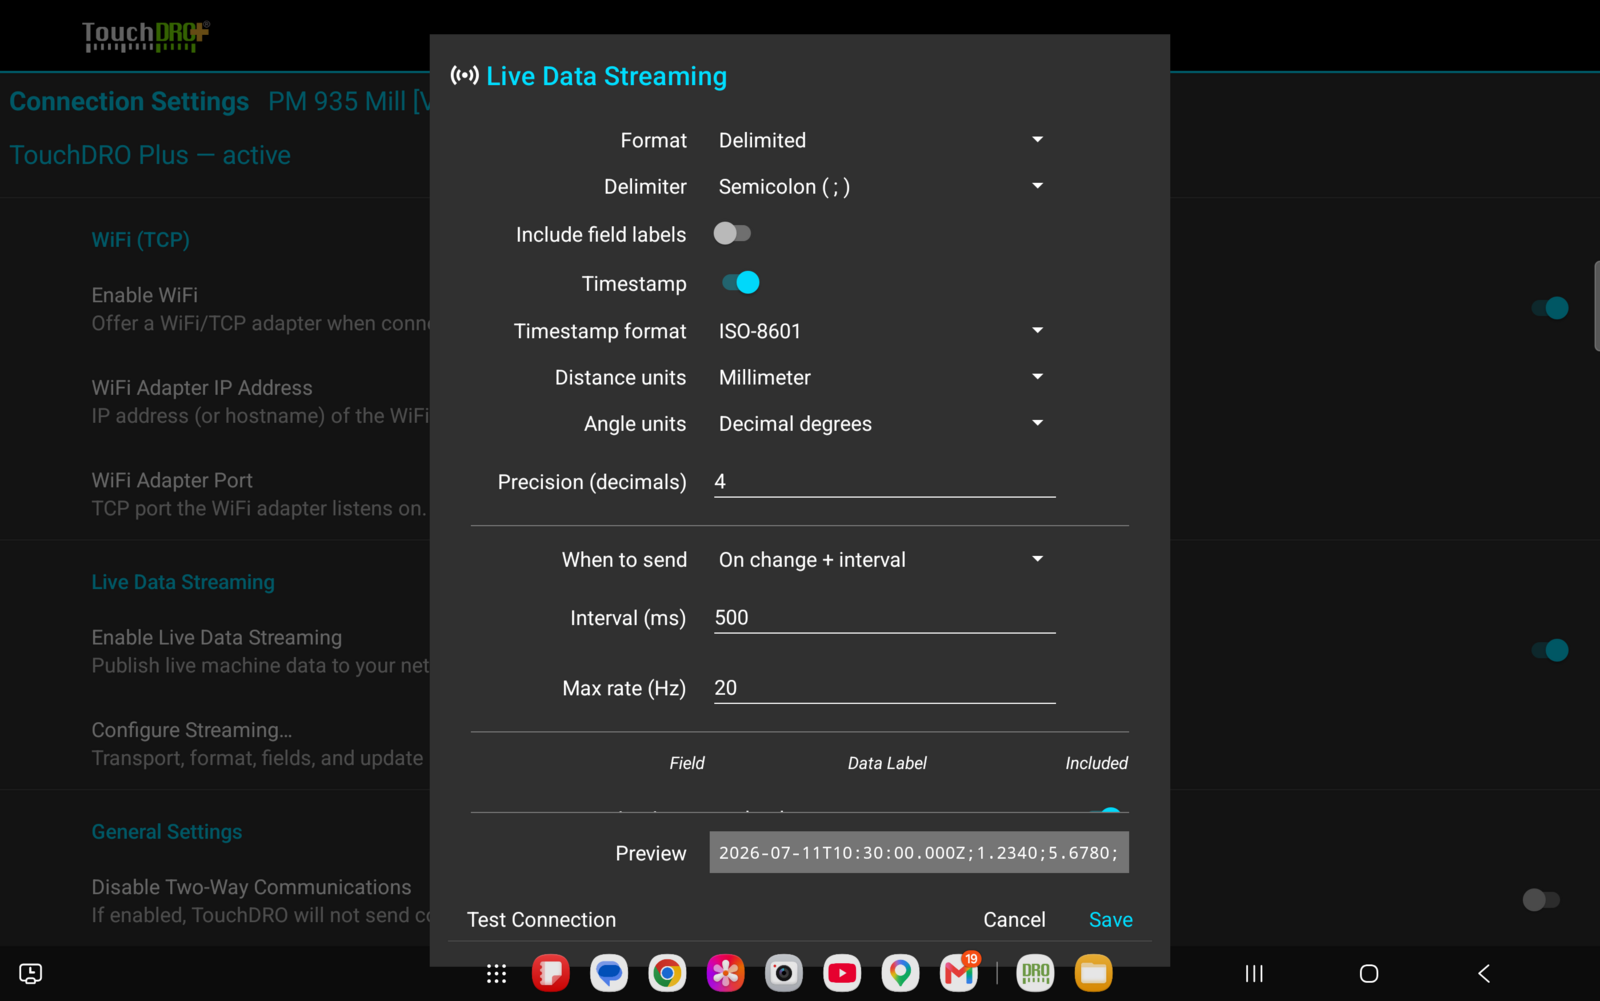
"Timestamp" adds the time of the reading, not the time it was sent, either as ISO-8601 in UTC with milliseconds or as Unix epoch milliseconds. "Distance units" and "Angle units" set the units the values are published in, which are independent of what the readout displays. "Precision (decimals)" sets the number of decimal places, from 0 to 6.
How Often Records Are Sent
"When to send" has three modes. "Fixed interval" sends a record every tick whether anything moved or not. "On change (capped)" sends only when a value changes, up to the rate ceiling. "On change + interval" does both, sending on change and at least once per interval, which gives a consumer a heartbeat from an idle machine.
"Interval (ms)" accepts 50 to 5000 milliseconds, and "Max rate (Hz)" accepts 1 to 20 records per second. Only the field that applies to the selected mode is shown.
A value counts as changed when the published number changes at the precision and units set in the format section, not when the raw encoder count changes. Without that rule, count level jitter on a stationary axis would make the change modes fire at the maximum rate continuously. Raising the precision therefore makes the stream more talkative as well as more detailed.
Choosing Fields
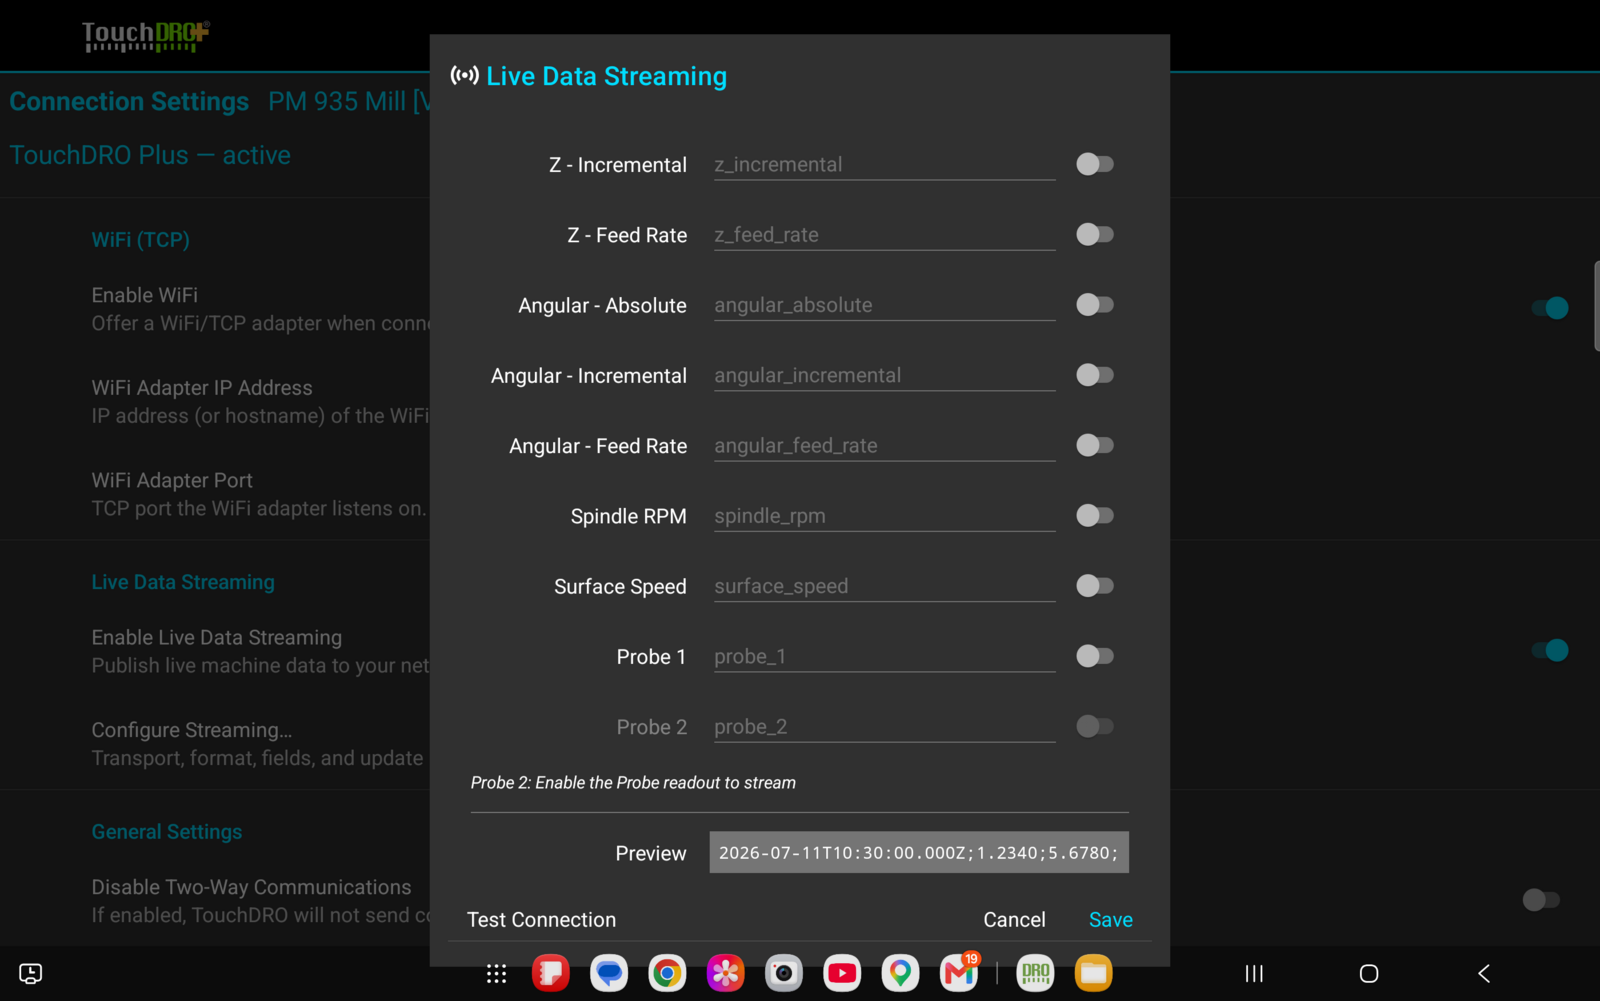
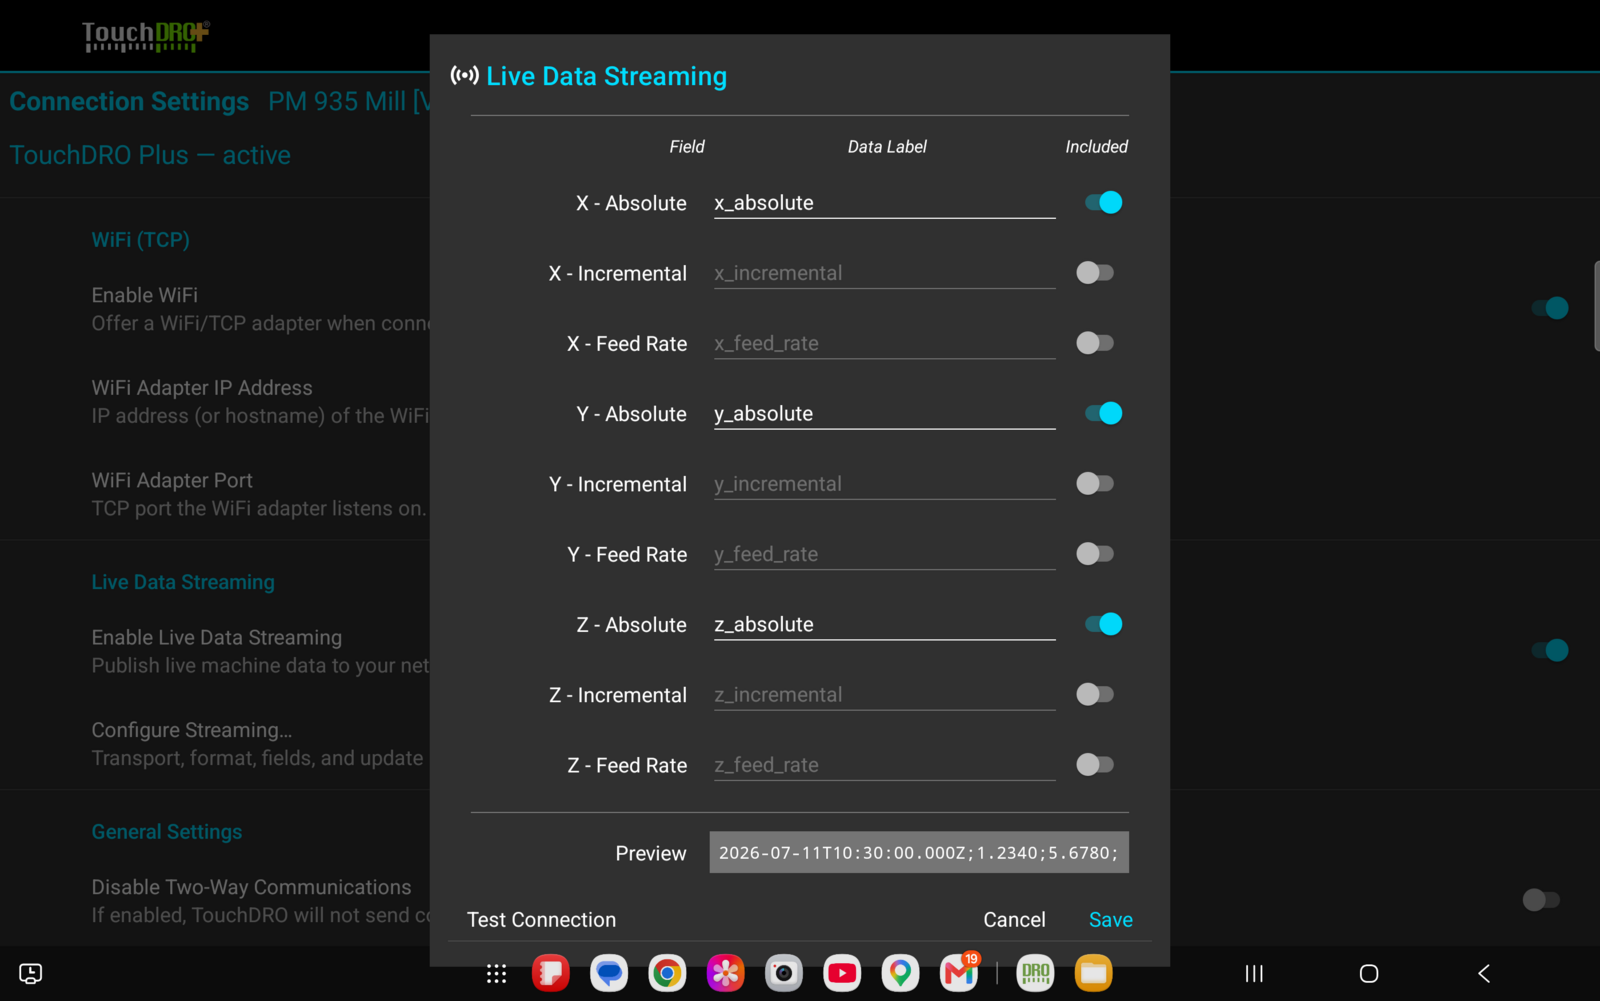
The bottom of the dialog lists every field that can be published. Each row has a switch under "Included" and an editable name under "Data Label", which is the name the field is given in labeled delimited output and in JSON. Position fields for X, Y, and Z start out included and everything else starts out switched off, which keeps the default record small.
Two labels that are the same will block "Save", since a consumer has no way to tell the two columns apart. A label left blank falls back to the field's default name.
A field whose hardware isn't present is grayed out and the reason is printed under the list. The row keeps its switch and its label, so a configuration made for one machine survives being loaded on another.
An included field that has nothing to report still occupies its place in the record. Delimited output leaves the column empty and JSON output publishes the key with a null value, so the shape of the record stays the same and a consumer configured against it doesn't have to be reconfigured. The same thing happens for a few seconds after a USB or WiFi adapter connects, while the position data settles: every position, feed rate, and RPM field publishes null until the readings are ready. A consumer that treats null as "no reading right now" needs no special handling for it.
What the Fields Contain
The values follow what the operator sees on screen in the matching mode, with the calibration, the tool offset, and the datum already applied.
| Field | Contents |
|---|---|
| Absolute | The axis position as the readout would show it in absolute mode |
| Incremental | The same position as the readout would show it in incremental mode |
| Feed Rate | Axis speed in the configured distance unit per minute |
| Spindle RPM | Whole revolutions per minute; the precision setting doesn't apply |
| Surface Speed | Cutting speed, in feet per minute when the distance unit is imperial and meters per minute otherwise |
| Probe 1, Probe 2 | Contact state as 1 or 0, for probe ports P and Q respectively |
| Probe 1 trigger fields | Where the machine was, which way it was moving, and when, at the moment of a touch on port P |
The probe trigger fields are what an inspection log needs and a position stream can't reconstruct. Correlating a periodic position record against the moment the probe made contact only resolves the touch to within one cadence interval, while these fields carry the position, the approach direction, the time, the count, and the feed rate at the instant the switch opened.
Preview and Test Connection
"Preview", at the bottom of the dialog, renders one record using the current settings, so the effect of a delimiter, a label, or a timestamp choice is visible before anything is published. The values in it are samples rather than live readings.
"Test Connection" checks the settings as they stand in the dialog without disturbing a stream that is already running. On TCP it confirms that the port can be opened; on MQTT it connects to the broker and reports what happened, which is the quickest way to separate a wrong address from a rejected password.
"Save" writes the configuration and applies it. If the stream is running, it will stop and start again with the new settings, which means connected consumers will reconnect and the sequence numbering will restart.
The Streaming Button
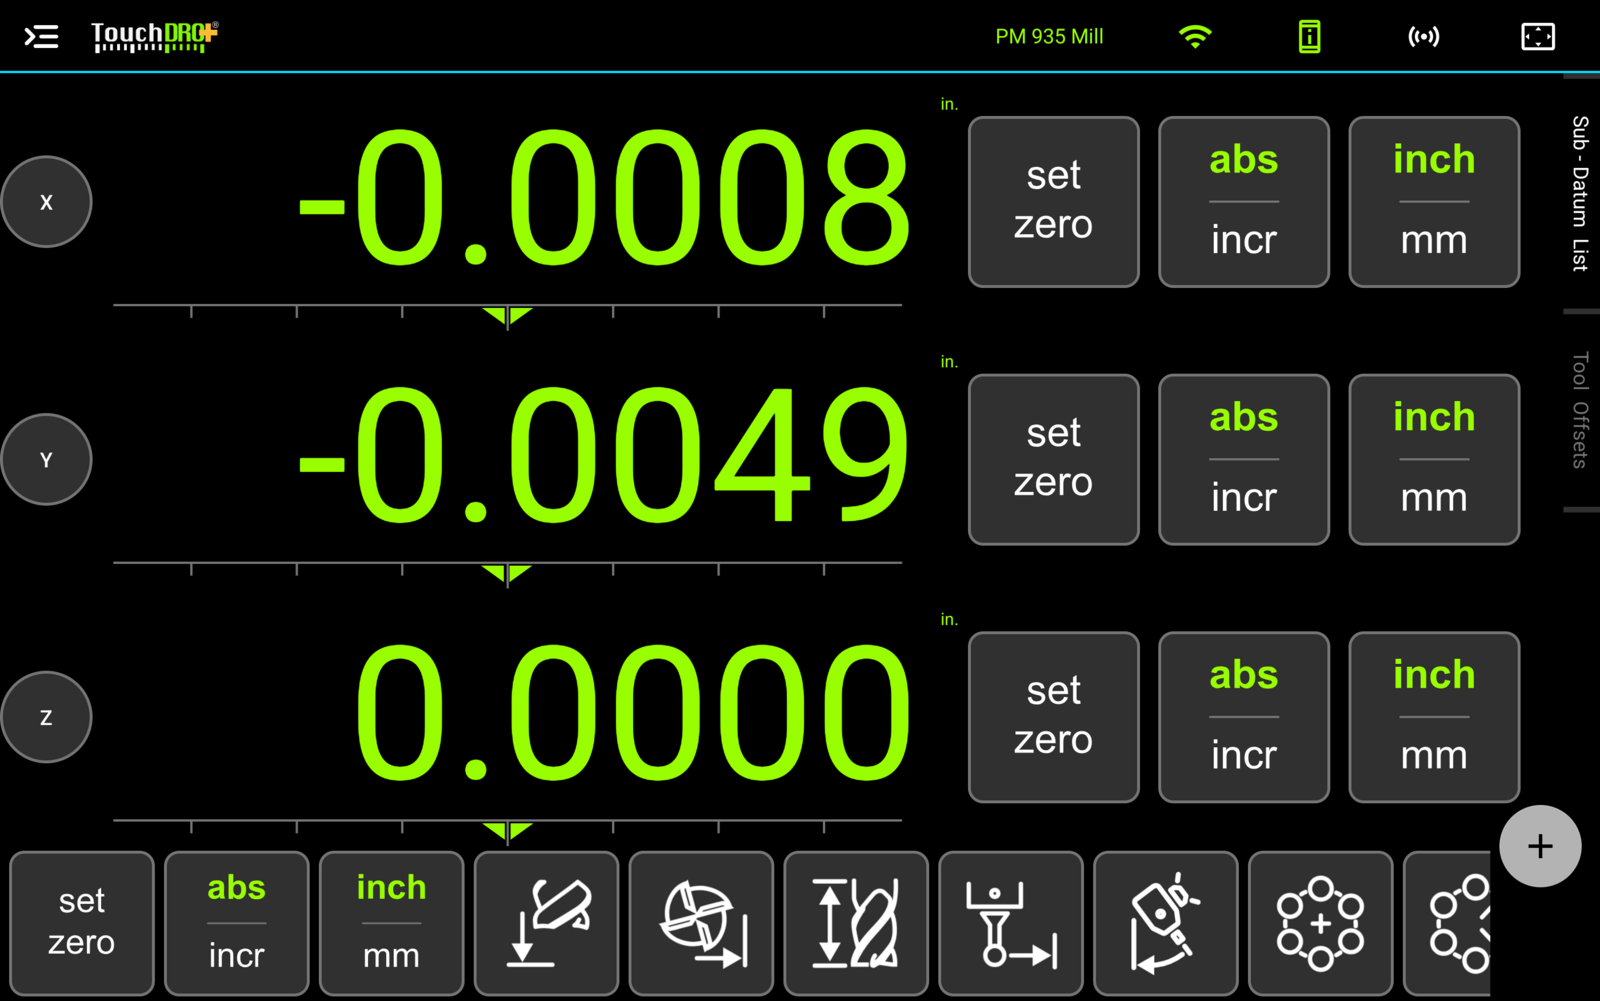
A broadcast button appears in the toolbar whenever the feature is enabled and TouchDRO Plus is active. It reports the state of the stream in five ways:
| State | Meaning |
|---|---|
| Dim | Stopped |
| Animated | Starting up, opening the port or connecting to the broker |
| Lit | Up and waiting, with no consumer connected yet |
| Lit, slowly pulsing | Sending records |
| Amber | Something is wrong with the stream |
- To start or stop the stream, tap the button.
- To open the configuration dialog, press and hold the button.
- To see what went wrong while the button is amber, tap it. This opens the diagnostics rather than stopping the stream.
When the Stream Has a Problem
A publisher that fails quietly is worse than one that doesn't run, because the readout goes on working and the data stops arriving somewhere else entirely. TouchDRO watches the stream and turns the button amber when the broker can't be reached, the password is refused, the TLS handshake fails, the TCP port is already in use, messages start failing in numbers, or nothing has gone out for several times the expected interval.
To see what happened, tap the amber button. This will open the "Streaming Interrupted" dialog, which names the endpoint, describes the problem in plain language, and says how long ago the last message got through and what share of recent messages failed. "Keep Trying" closes the dialog and leaves the stream alone, which is usually right since a broker restart or a network blip will clear on its own. "Stop Streaming" shuts the stream down.
Frequently Asked Questions
[Expand]Does Live Data Streaming require TouchDRO Plus?
Yes. The feature is part of TouchDRO Plus. On a machine profile without Plus, the "Enable Live Data Streaming" switch is visible in the Connection Settings but can't be turned on.
Does the stream keep running when TouchDRO is in the background?
No. TouchDRO publishes only while it is the app on screen. There is no background service, so switching to another app or letting the tablet sleep interrupts the stream. TouchDRO already keeps the screen awake while it is running, so in practice the stream runs as long as the readout is in use.
Can a SCADA system or anything else on the network control TouchDRO through this connection?
No. The stream is one-way. TouchDRO sends records out and reads and discards anything sent back, so nothing on the network can command the readout, change a setting, or zero an axis.
Does TouchDRO work with Ignition, Node-RED, or Home Assistant?
Yes. In TCP mode, TouchDRO streams newline-terminated records that the Ignition TCP driver and Node-RED read directly. In MQTT mode, it publishes to any standard broker, such as Mosquitto or the broker a Home Assistant installation already runs, and tools like Telegraf subscribe to the topic from there.
Why don't the streamed values match the screen exactly?
The stream formats its own values. It uses the units and precision set in the streaming configuration rather than the display settings, always uses a period as the decimal separator, and on a lathe it streams the true axis position even when the screen shows X as a diameter.
How fast is the stream, and is it real-time?
Up to 20 records per second, and the configured rates are targets rather than guarantees. Android scheduling, the network, and the broker all add jitter, so the stream is suitable for monitoring and logging but not for closed-loop control.
What happens to the data when the connection drops?
It is not kept. Records are dropped while a broker is unreachable or a consumer isn't reading, and nothing is replayed on reconnection. Consumers can detect the gap from the sequence number in each JSON record. A logger that needs a complete record should hold its own connection to the stream.