Monitoring a Manual Mill with MQTT
A CNC machine reports what it is doing; a manual machine keeps it to itself. If you want to know how much a manual mill actually runs, log the positions it visited during a job, or just see spindle RPM from across the shop, there is normally nothing to ask, because there is no controller to ask.
TouchDRO changes that. With Live Data Streaming, the digital readout publishes position, feed rate, and spindle data over TCP or MQTT, and anything on your network can consume it. In this guide, we will get that stream onto a live dashboard using software that costs nothing: first a bare TCP connection to prove the data is flowing, then a proper dashboard with Mosquitto and Node-RED, with shortcuts for Home Assistant, Grafana, and Ignition.
Prove It with Raw TCP
Before installing anything, it's worth seeing the stream with your own eyes. In TCP mode TouchDRO is the server: it listens on a port, and anything that connects to the tablet's address receives one record per line.
- Switch the stream on and open its settings, as described in "Turning It On"
- Set "Transport" to "TCP (server)" and "Format" to "JSON", and note the port
- Find the tablet's IP address in your router's client list or the tablet's WiFi details
Then, on any computer on the same network, run this three-line Python script with the tablet's address and port filled in (the port is 5800 unless you changed it):
import socket
s = socket.create_connection(("192.168.1.50", 5800))
while True: print(s.recv(4096).decode(), end="")
Crank a handwheel. Each line that appears is a JSON record with the axis positions, published as the readout changes. That is the whole feature; everything below is about pointing the same records at something more useful than a terminal window.
The Main Build: Mosquitto and Node-RED
For a dashboard, MQTT is the better transport: TouchDRO connects out to a broker, and any number of consumers subscribe without the tablet knowing or caring. The standard free broker is Mosquitto, and the quickest free dashboard is Node-RED. Both run on a Raspberry Pi, an old laptop, or the shop PC, and both install with one command from their own documentation.
With the broker running, point TouchDRO at it: set "Transport" to "MQTT (client)", enter the broker's address, and give the machine a "Base topic" like "touchdro/mill-1". TouchDRO will publish records on "touchdro/mill-1/data" and a retained online/offline marker on "touchdro/mill-1/status", as described in the "Transport" section of the manual.
In Node-RED, the flow is three nodes: an "mqtt in" node subscribed to "touchdro/mill-1/data", a "json" node to parse the record, and dashboard gauges wired to the fields you care about. The gauge nodes come from the Dashboard palette, which isn't part of the stock install: open "Manage palette" in the Node-RED menu and install "node-red-dashboard" first. The "What the Fields Contain" section lists every field the stream can carry.
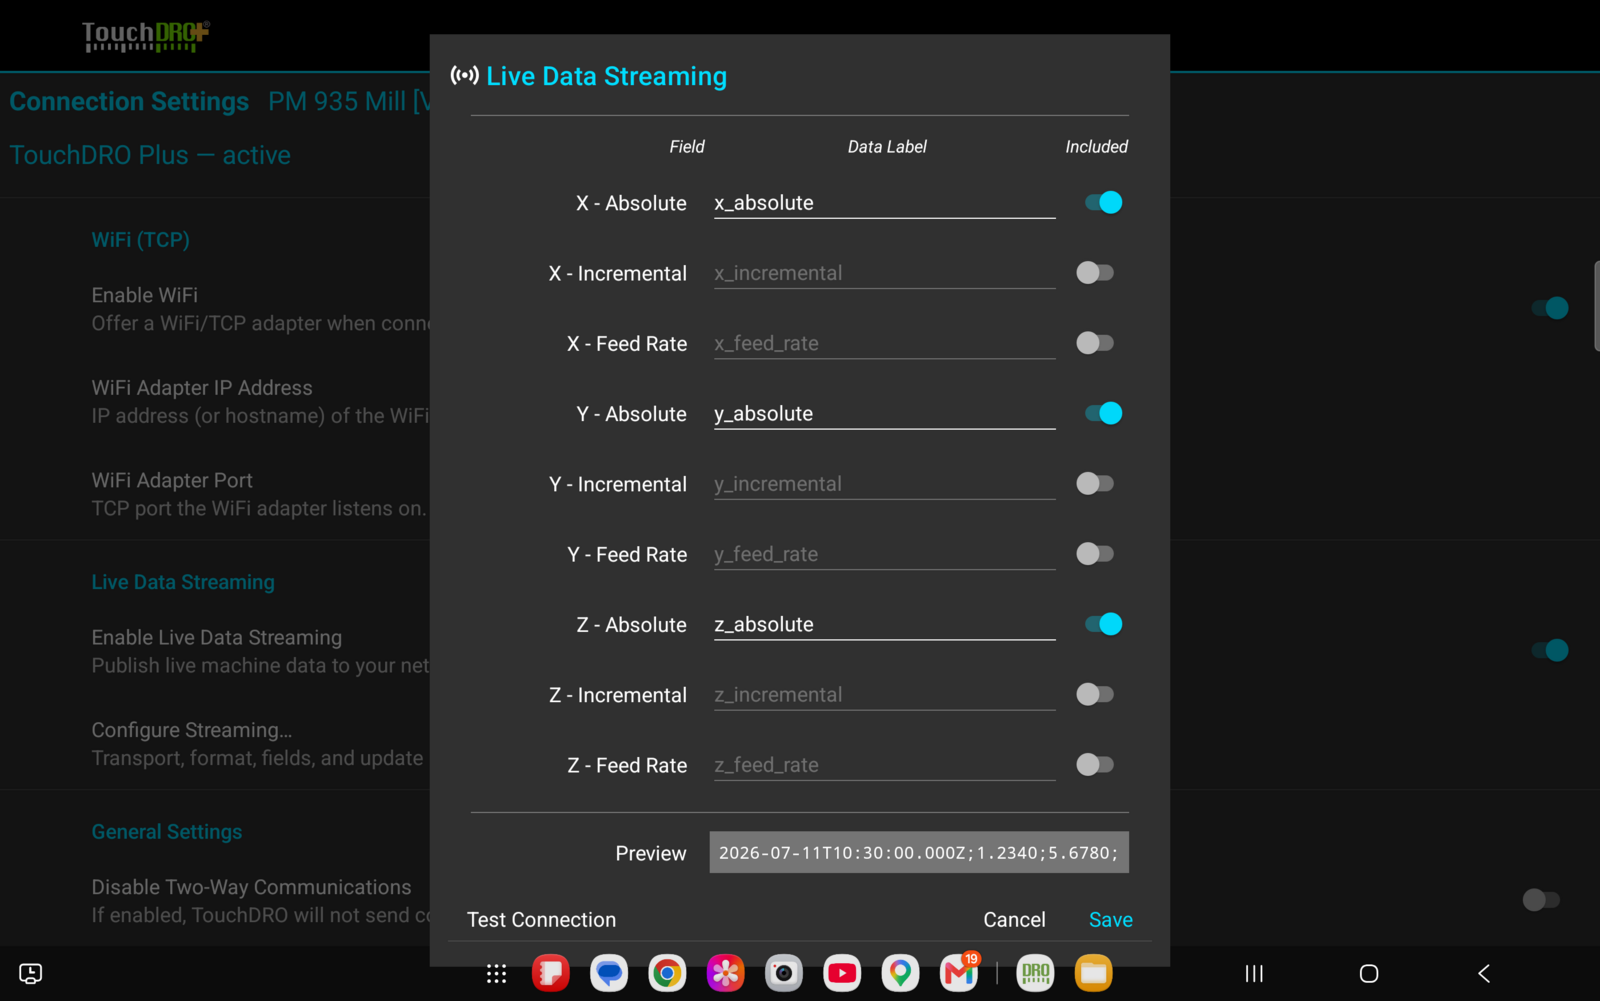
Set "When to send" to "On change + interval" so the dashboard follows the handwheels but still gets a heartbeat from an idle machine. The cadence options are covered in "How Often Records Are Sent".
If You Already Run Home Assistant
A Home Assistant installation very likely runs an MQTT broker already, through the Mosquitto add-on. In that case there is nothing new to install: point TouchDRO at the broker you have, and define a sensor per field you want to track:
mqtt:
  sensor:
    - name: "Mill X Position"
      state_topic: "touchdro/mill-1/data"
      value_template: "{{ value_json.x_absolute }}"
      availability_topic: "touchdro/mill-1/status"
The retained status topic gives Home Assistant an honest availability signal: a machine whose tablet has gone away shows as unavailable rather than frozen at its last position.
The Professional Version
The same stream feeds the industrial tools. Telegraf subscribes to the MQTT topic and writes to InfluxDB, which is what a Grafana dashboard with history wants: not just where the machine is, but how much it actually ran over the week, which is the number OEE tracking is after.
If you want to see what the stream looks like in a real SCADA package, Ignition Maker Edition is free for personal use, and its TCP driver reads TouchDRO's newline-terminated records directly. It is the same software running the dashboards in production plants; a manual mill publishing into it is a strange and satisfying thing to see.
Where This Does Not Work
TouchDRO publishes only while the application is in the foreground, so a tablet that sleeps or switches apps interrupts the stream. For monitoring that matters, keep the tablet powered and TouchDRO on screen.
The stream is telemetry, not a record of every position: records are dropped rather than queued when a consumer or broker is unreachable, and the sequence number in each JSON record is how a consumer notices. It is not a control channel and not a safety interlock; the manual page covers what the stream does and does not guarantee.